
书签仪表板管理软件DashMachine
什么是 DashMachine ?
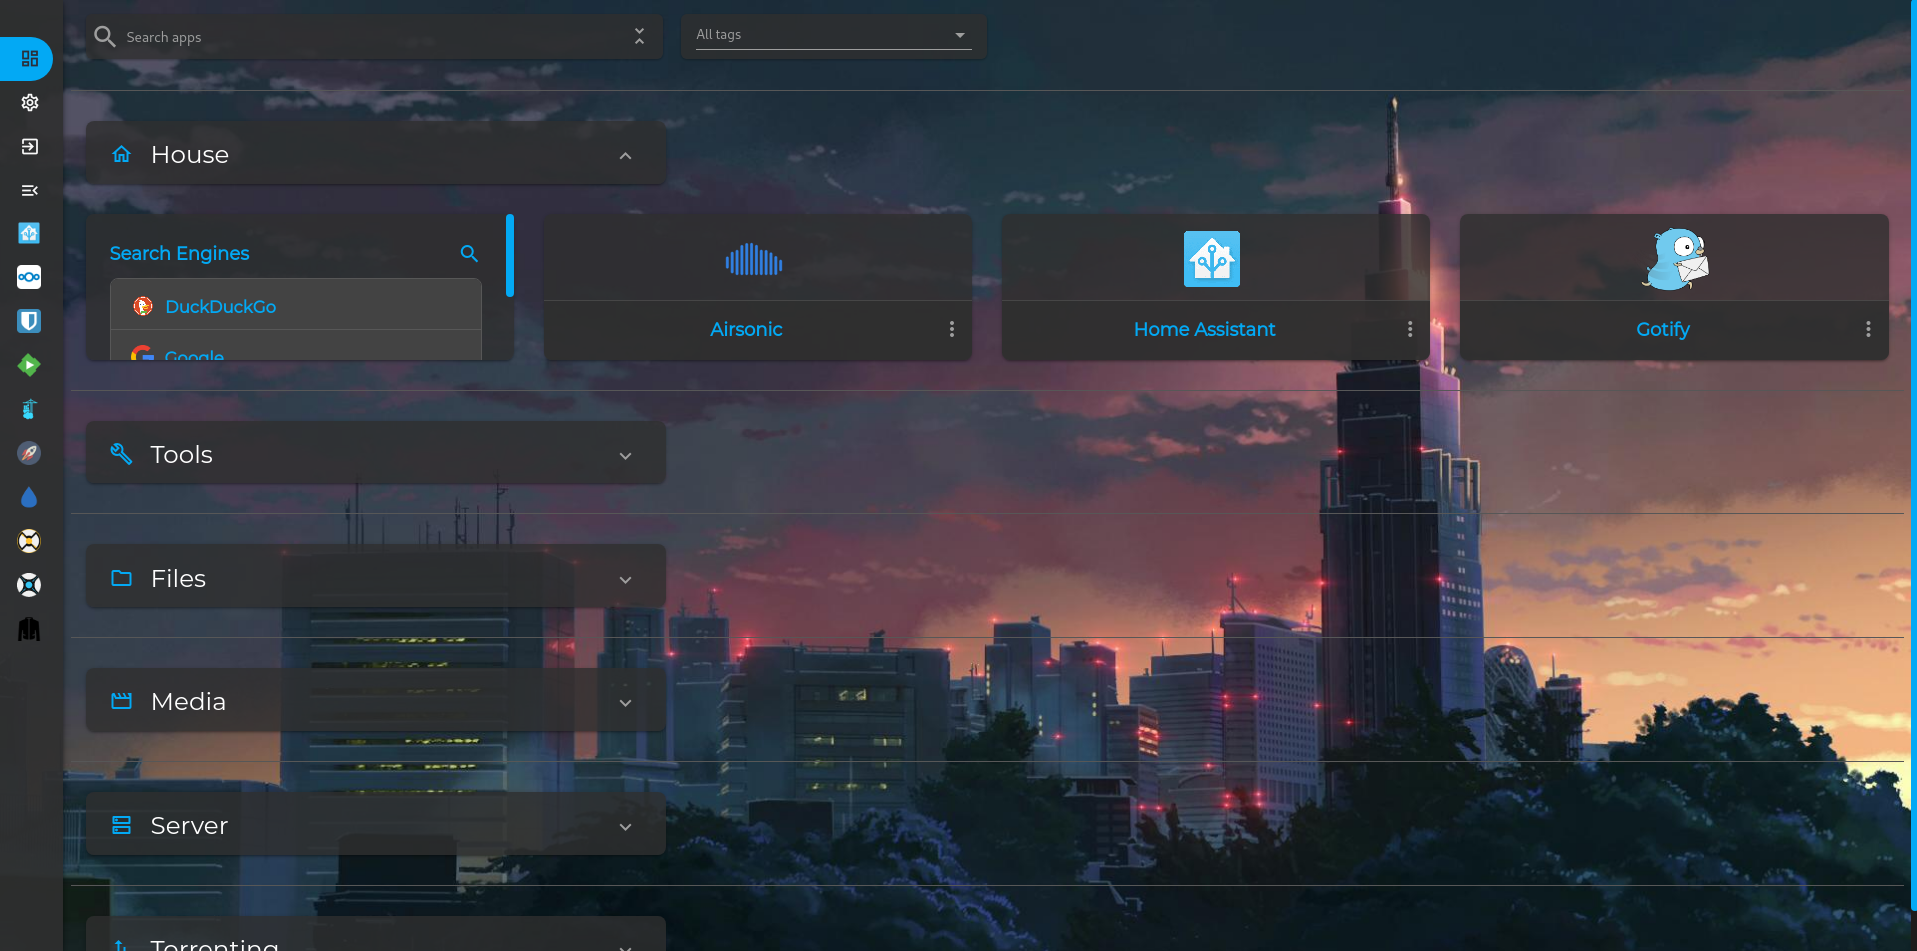
DashMachine是一个具有有趣功能的Web书签仪表板应用程序,让你能够从一个仪表板管理所有自托管应用程序。
DashMachine 使用单个 .ini 文件进行配置,管理起来比较方便;支持数据源,因此可以实现的不仅仅是书签功能,而且支持高大上的 Dashboard,实现数据可视化。不过需要说明的是,代码已经有 1 年多没更新了,当然这并不影响我们的研究、试用。
安装
在群晖上以 Docker 方式安装。
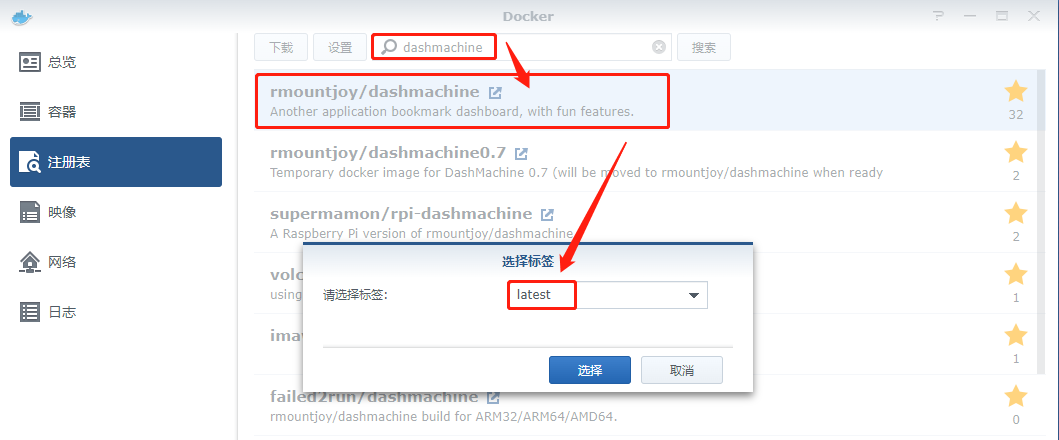
在注册表中搜索 dashmachine ,选择第一个 rmountjoy/dashmachine,版本选择 latest。
卷
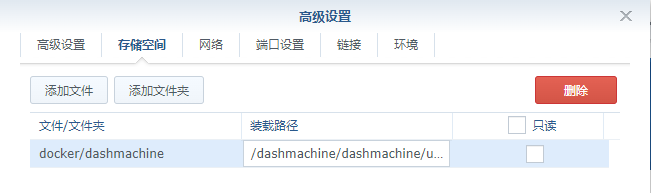
在 docker 文件夹中,创建一个新文件夹,并将其命名为 dashmachine
| 文件夹 | 装载路径 | 说明 |
|---|---|---|
docker/dashmachine |
/dashmachine/dashmachine/user_data |
存放设置 |
端口
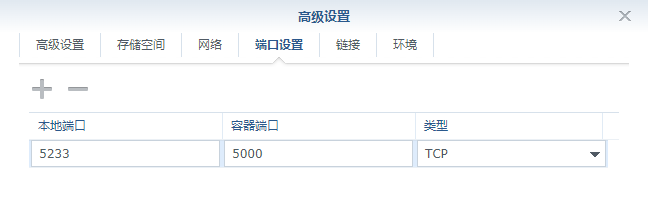
端口不冲突就行,不确定的话可以用命令查一下
1 | # 查看端口占用 |
| 本地端口 | 容器端口 |
|---|---|
5233 |
5000 |
运行
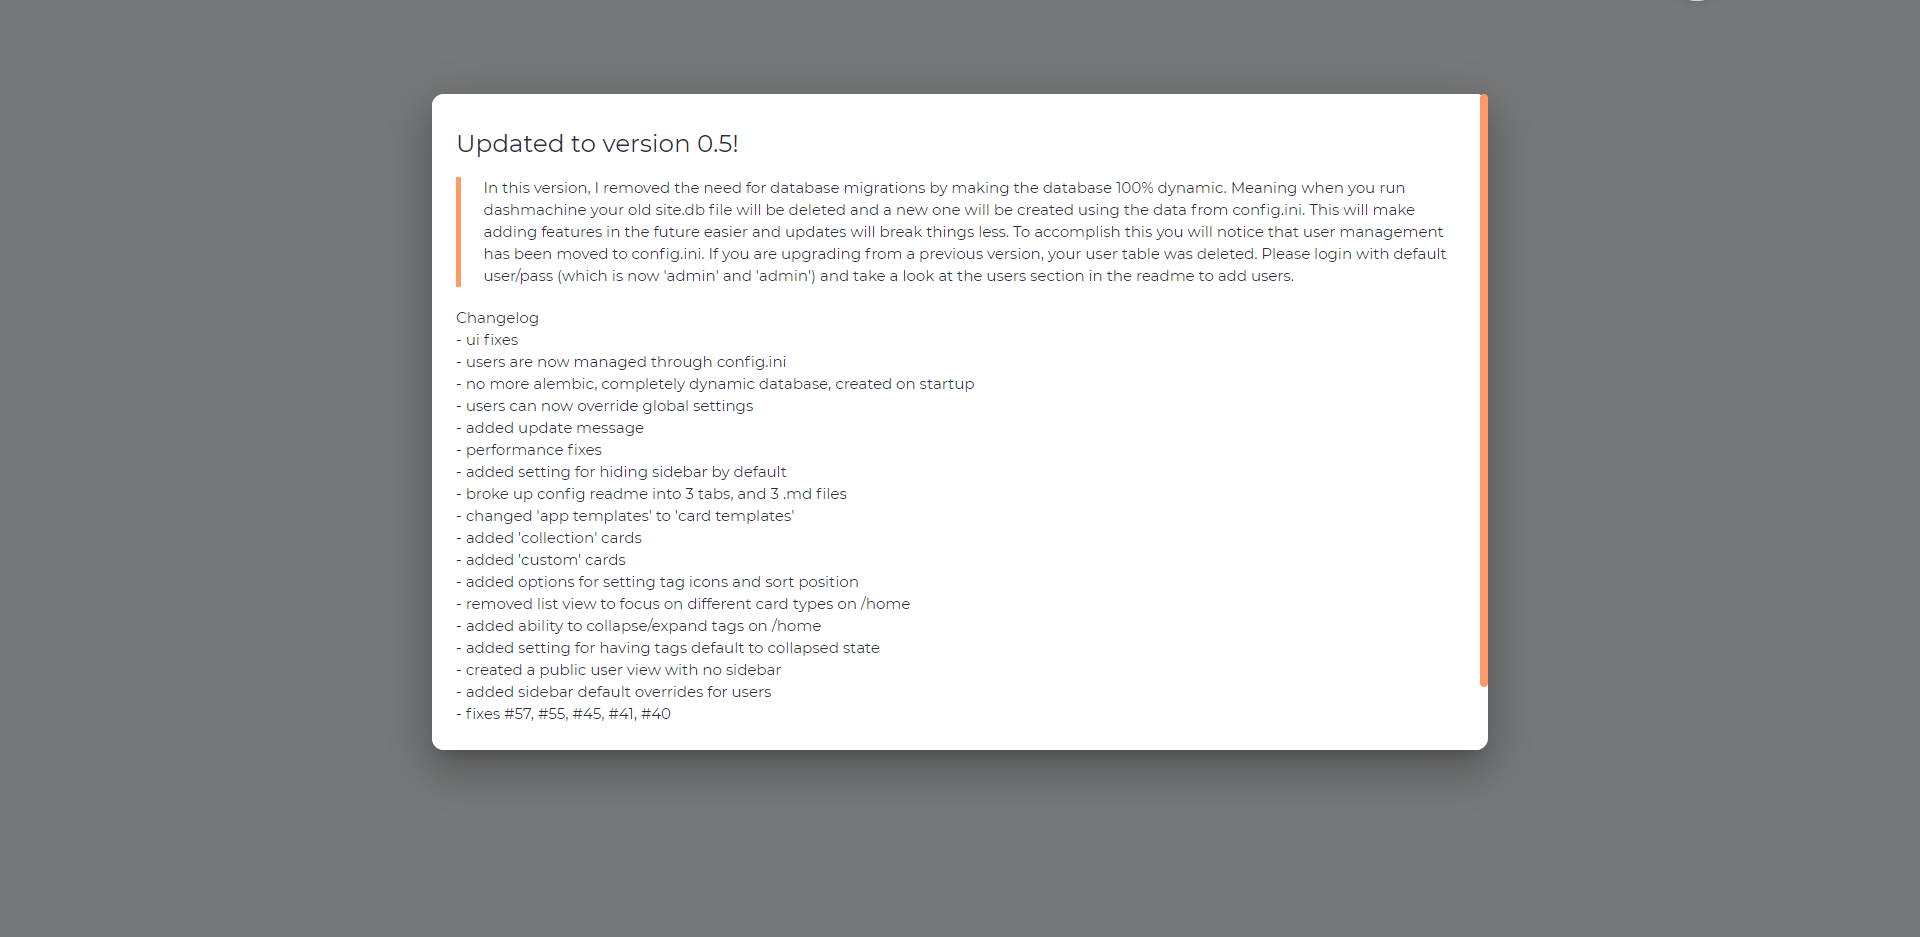
在浏览器中输入 http://群晖IP:5233 就能看到一段说明,往下拉会看到两个按钮
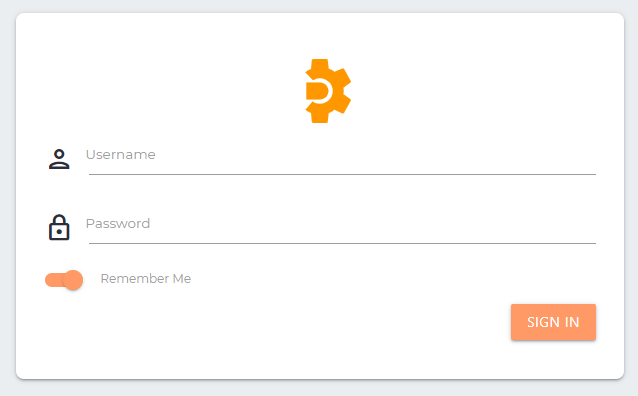
接下来需要登录

点 GO TO LOGIN 登录
默认的账号:
admin,密码:admin
第一次进入后台,什么都没有
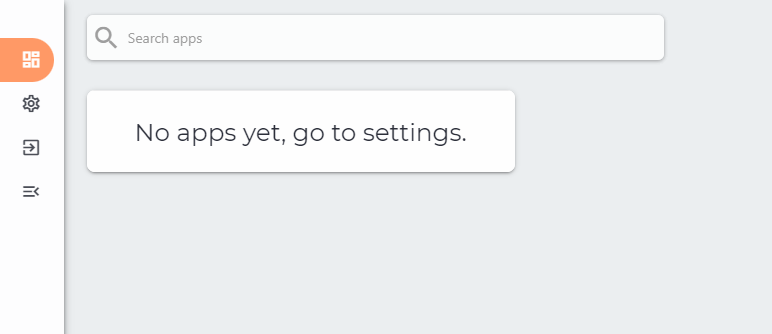
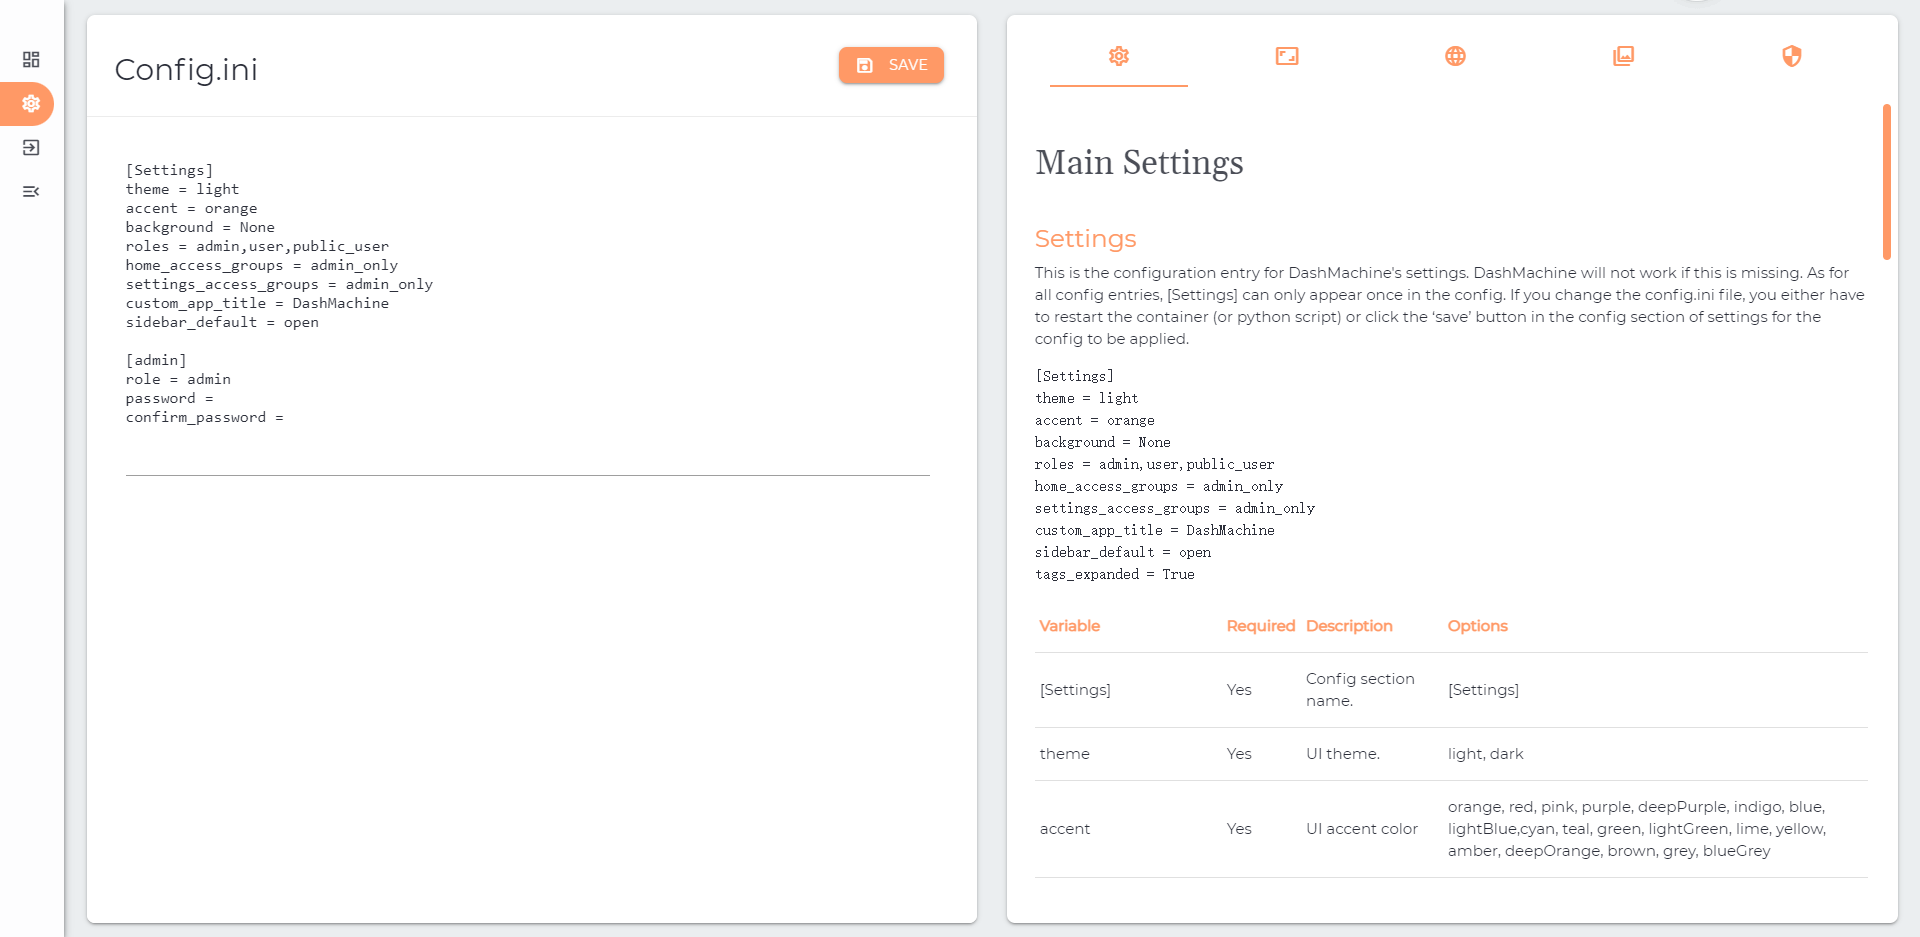
点 Setting 开始编辑,左侧是 Config.ini 的内容,右侧是说明
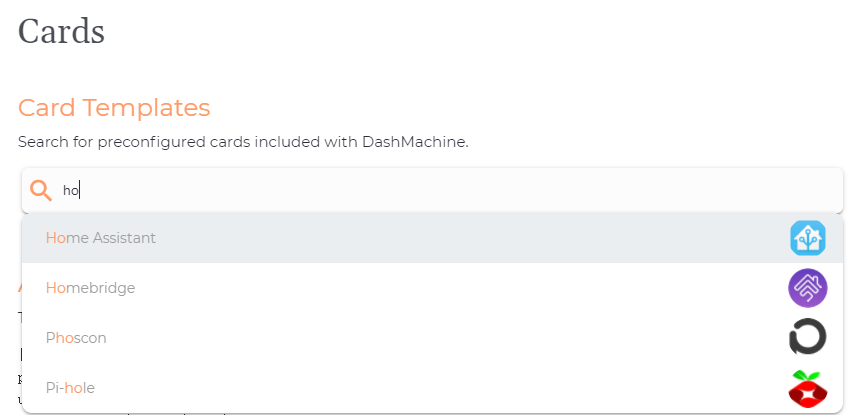
卡片
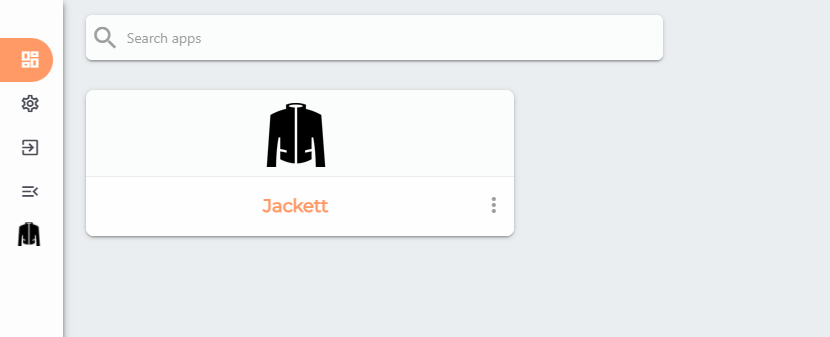
搜索支持联想功能,比如输入 Ho 会自动过滤
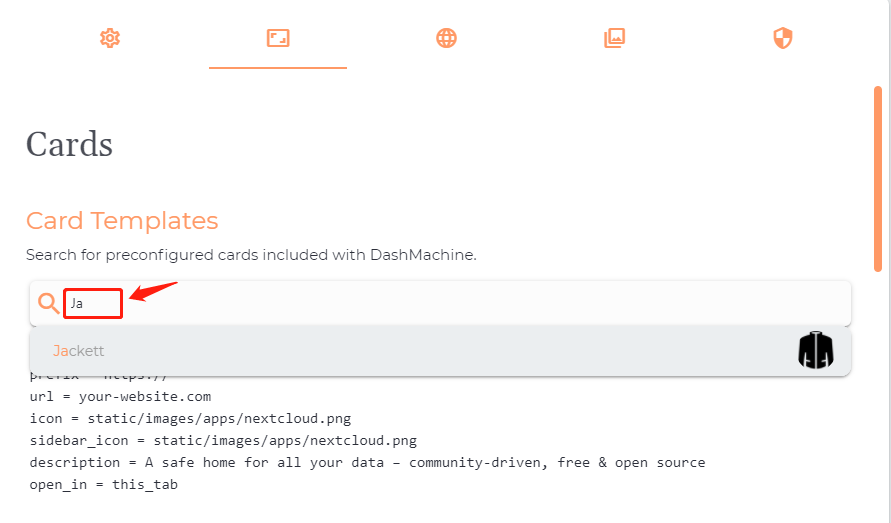
再试试 Ja
自动生成的示例,直接复制到左侧
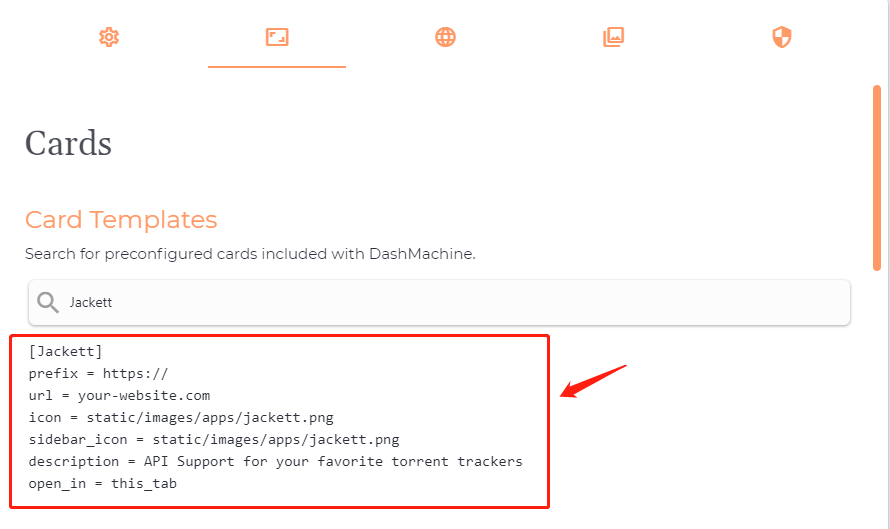
一般只要修改 prefix 和 url 后即可
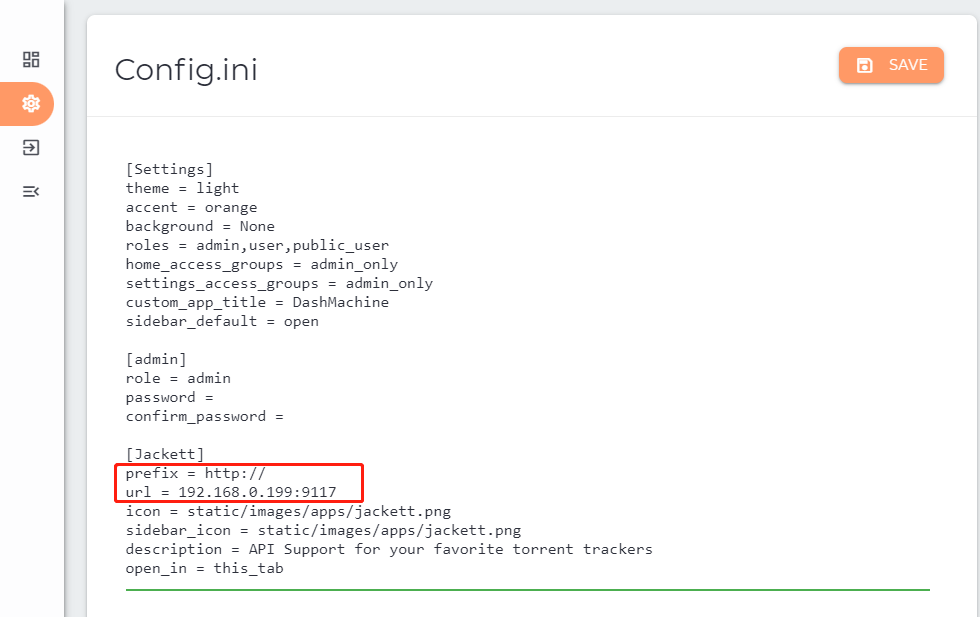
保存之后回到首页
数据源
这是 DashMachine 最有趣的地方,可以通过不同的数据源,在 DashMachine 上显示数据,类似于仪表板(DashBoard)的功能
curl
以官方提供的 MyIP 为例,如果您在浏览器中输入 https://api.myip.com 会返回👇这样的数据
1 | {"ip":"114.93.213.71","country":"China","cc":"CN"} |
而我们需要的是 ip,所以第一段用于 获取数据 是👇这样的
关于各字段的含义,请阅读官方的文档
1 | [test] |
第二段则用于 展示数据
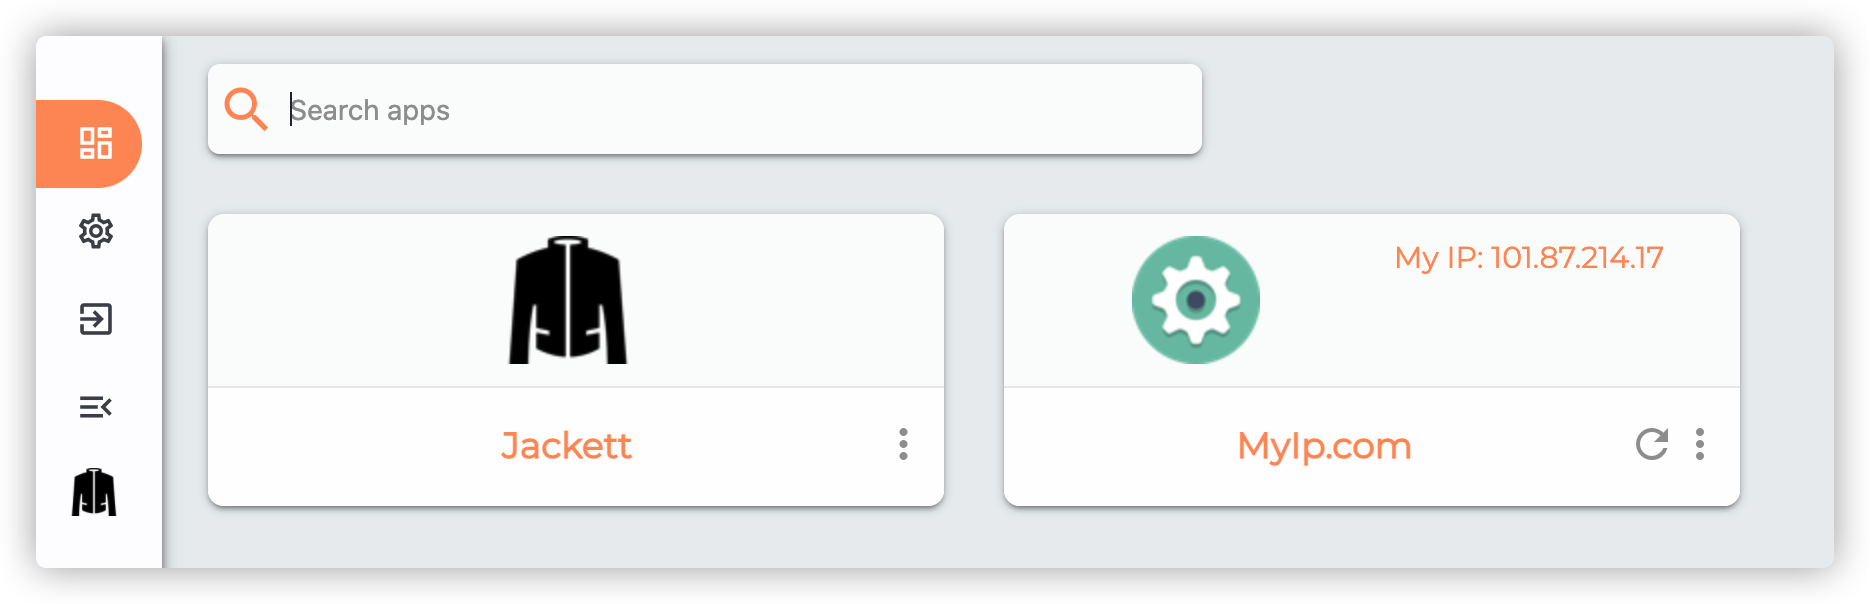
1 | [MyIp.com] |
呈现的效果
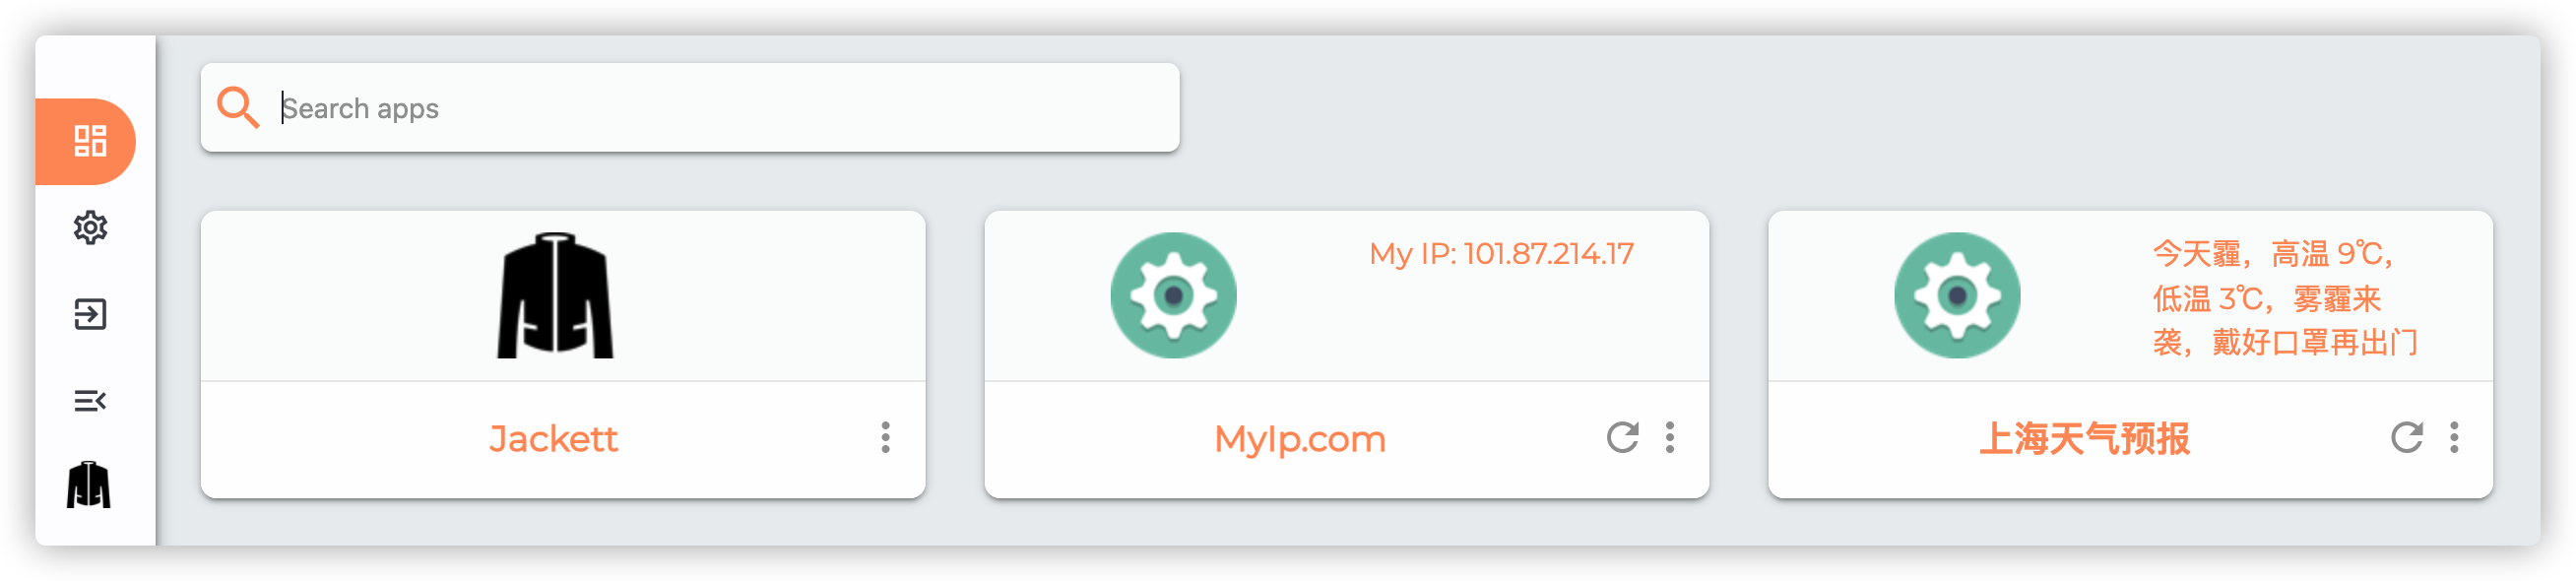
再以老苏常用的天气为例子( DashMachine 也有专门的 Weather 数据源)
关于天气数据,可以参考『 用Changedetection监控网页的变化 』一文中的
JSON-API-监控部分
1 | [shtq] |
展示效果
http_status
通过对给定 URL 进行 http 调用,并显示服务是否联机。
1 | [http_status_test] |
展示效果
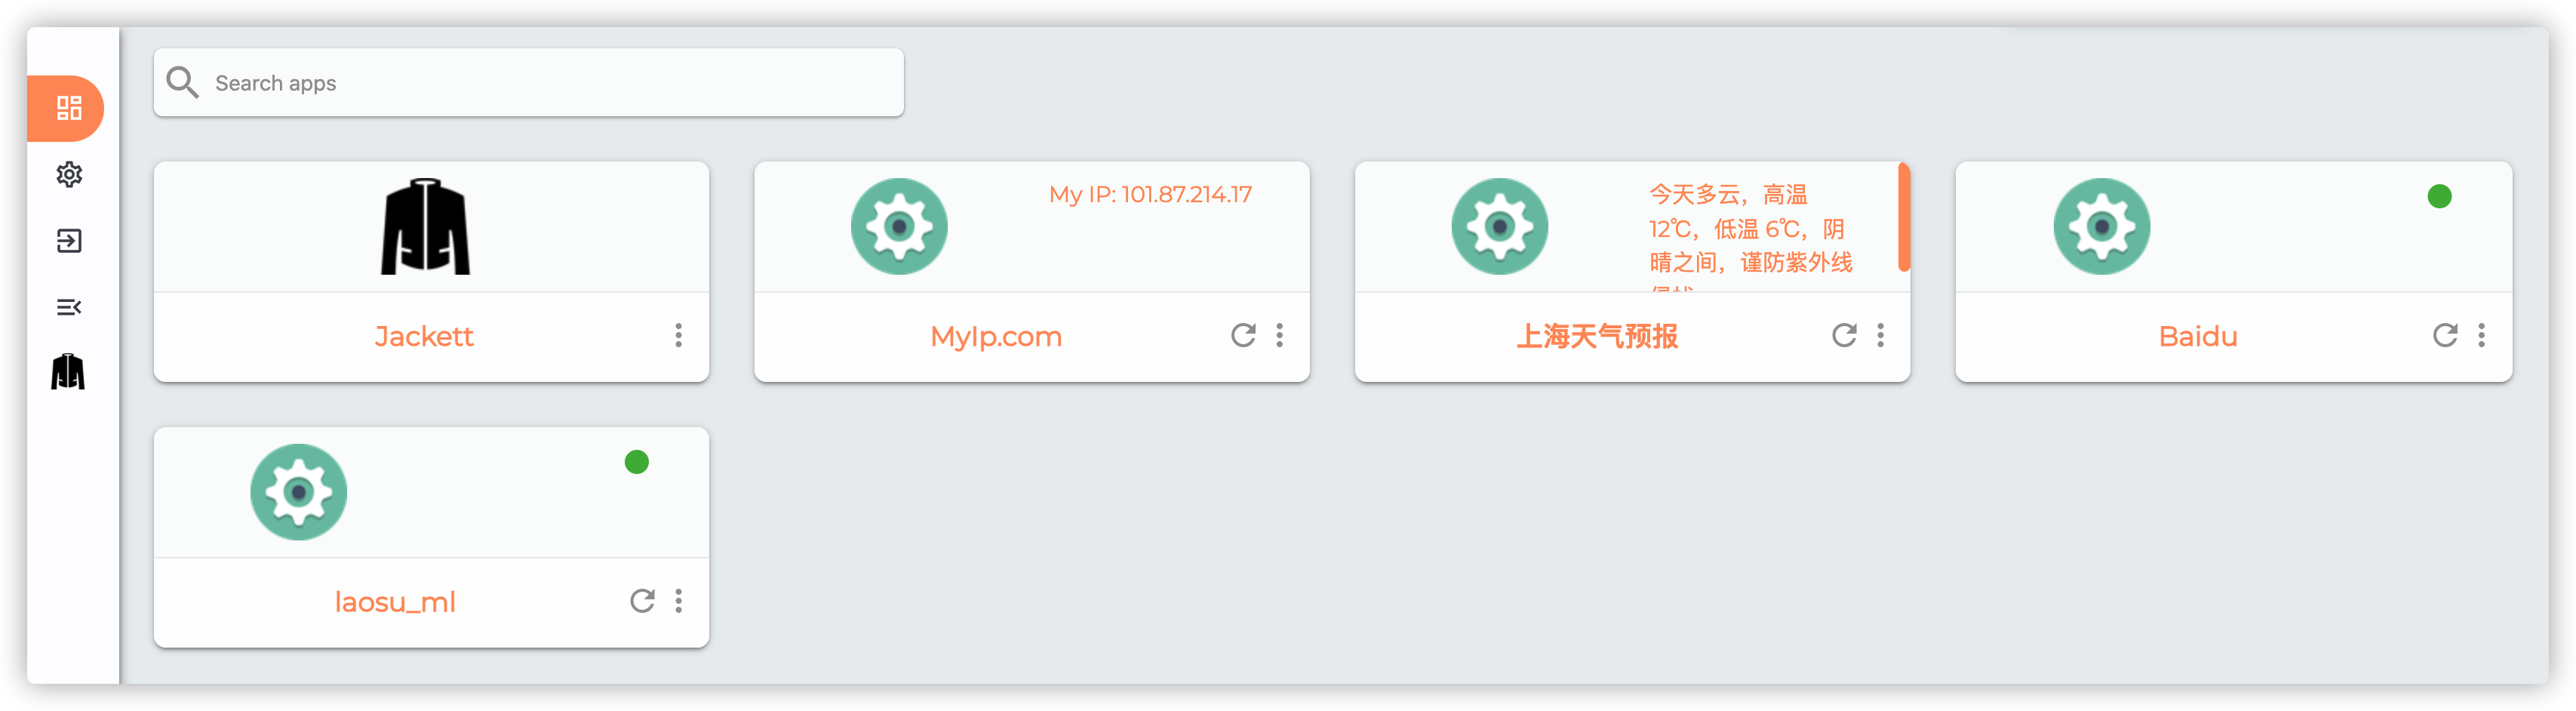
ping
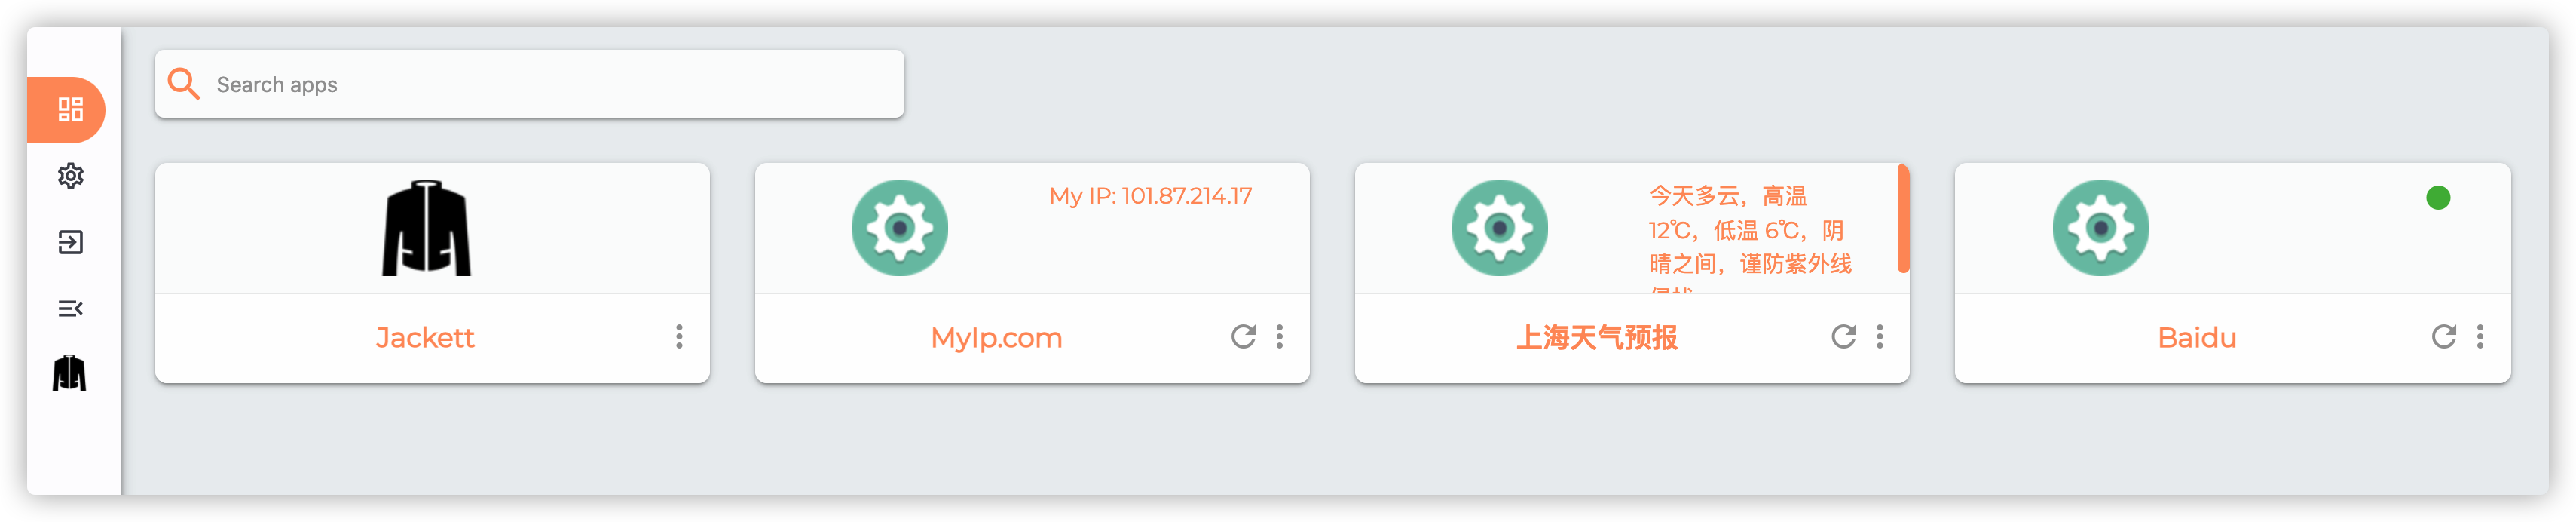
通过 ping 检查服务是否在线
1 | [ping_laosu_ml] |
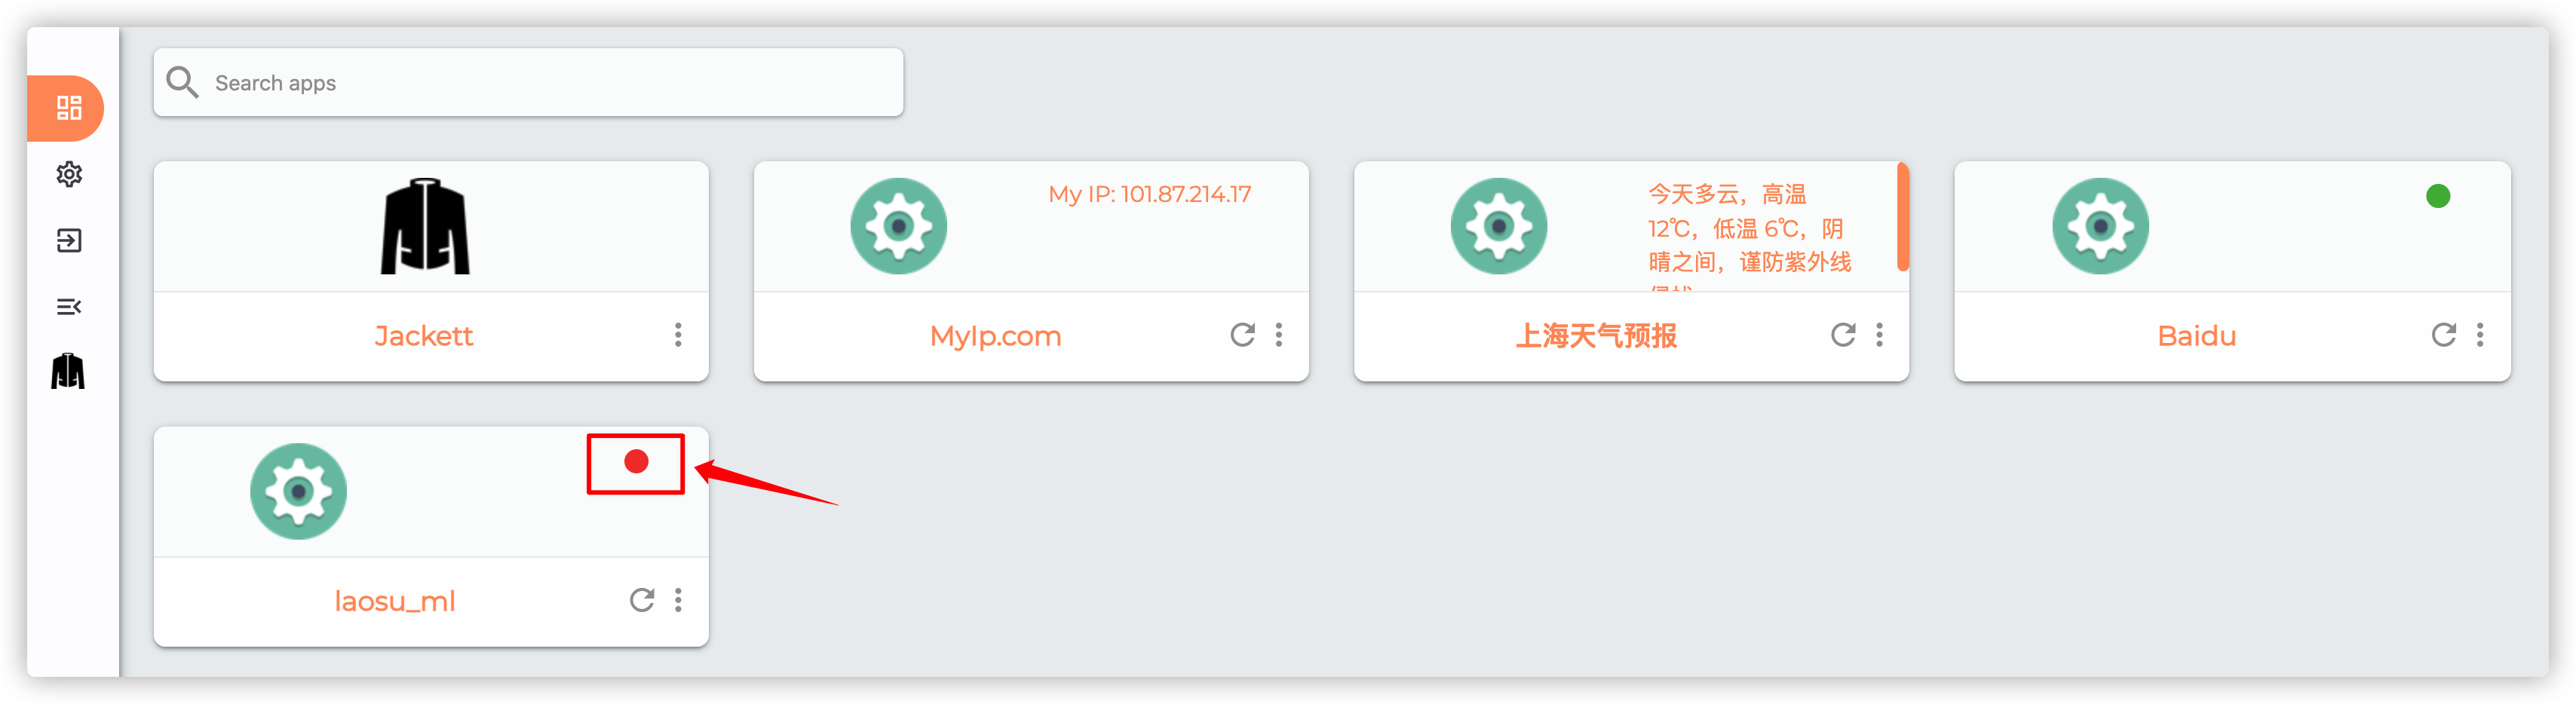
展示效果和 http_status,卡片右侧有个颜色按钮
将 [ping_laosu_ml] 中 resource 改为错误的地址,比如 laosu.mll
小结
老苏测试了几个通用的数据源,但数据源 Docker 老苏尝试失败了,原因没找到,配置用的是官方提供的,老苏只改了 IP 和端口,还是把设置贴出来吧,也许有人知道原因呢
http://192.168.0.197:9000是Portainer的本地访问地址,可正常使用
1 | [docker-endpoint-1] |
除此之外还有一些跟应用相关的数据源,比如 PiHole、Sonarr、Radarr 之类的,有兴趣可以研究看看。
参考文档
rmountjoy92/DashMachine: Another web application bookmark dashboard, with fun features.
地址:https://github.com/rmountjoy92/DashMachineManage your Self Hosted Applications using DashMachine – NAS Hosted
地址:https://geeked.host/manage-your-self-hosted-applications-using-dashmachine/